Config passive check
Config with nagios core:
vi /usr/local/nagios/etc/nagios.cfgaccept_passive_service_checks option is set to 1 as well.
Manual passive check
Create a plugin like active check article but in define service add two lines:
active_checks_enabled 0
passive_checks_enabled 1
Restart nagios:
sudo -sThis is the result:
service nagios restart
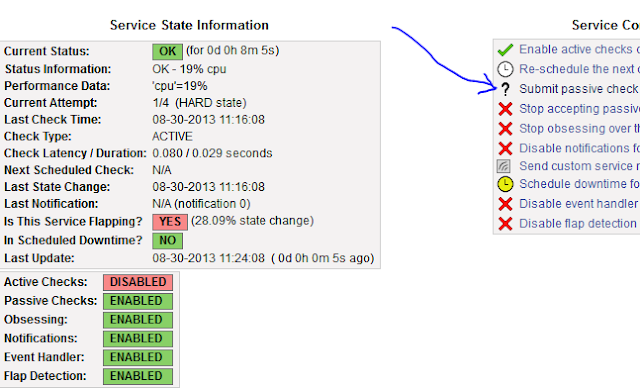
Click Submit passive check and fill it like this image:
refresh nagios webpage and wait few seconds and view Status information:
Other way:
Structure:
[<timestamp>] PROCESS_SERVICE_CHECK_RESULT;<host_name>;<service_description>;<service_status>;<plugin_output>Example:
sudo -s
CHECK="[`date +%s`] PROCESS_SERVICE_CHECK_RESULT;localhost2;Check cpu;0;Ok from commandline"
echo $CHECK >>/usr/local/nagios/var/rw/nagios.cmd
Passive check from remote host
Nagios server (ip: 192.168.0.221)
Install
sudo -sEdit nsca config:
apt-get install nsca
vi /etc/nsca.cfg
Content to change (if different), can change password to anythink you like but must match client and server:
Restart nscacommand_file=/usr/local/nagios/var/rw/nagios.cmdpassword=alohadecryption_method=1
nsca_group=nagios
nsca_user=nagios
service nsca restart
Client (ip: 192.168.0.33)
Install:
sudo -sConfig:
apt-get install nsca-client
vi /etc/send_nsca.cfgchange password and encryption_method like server
Check
Result Ok, but nagios don't do any think.echo -en "localhost2\tcheck cpu\t0\tCheck Ok from nsca\n" | send_nsca -c /etc/send_nsca.cfg -H 192.168.0.221
1 data packet(s) sent to host successfully.Debug:
vi /usr/local/nagios/var/nagios.log
and this is the reason:[1377855543] EXTERNAL COMMAND: PROCESS_SERVICE_CHECK_RESULT;localhost2;check cpu;0;Check111 Ok from nsca[1377855543] Warning: Passive check result was received for service 'check cpu' on host 'localhost2', but the service could not be found!
echo -en "localhost2\tCheck cpu\t0\tCheck Ok from nsca\n" | send_nsca -c /etc/send_nsca.cfg -H 192.168.0.221Wait for few seconds and data will be update in nagios.
You can see in active check article to see how to create graph.


No comments:
Post a Comment