Friday, 13 September 2013

Scapy, a power network tool for Python

When working, I must meet some project with create pakage, pppoe, ping, catch, filter, authentication ... And I was introduced to learn to use scapy.
Scapy is a power opensource library/app for python.


Homepage: http://www.secdev.org/projects/scapy/

First project I met is pppoe with pap/chap authentication to connect to some bras, server and Scapy support it with automata (advanced function of scapy).

You can see here to know pppoe:

And this is a code

Chap authen


and we can use scapy with other protocols. At the present, I am not sure about Scapy, so you can go to http://networkingbodges.blogspot.com or homepage of scapy to get more information.

Friday, 30 August 2013

Create a simple Nagios plugin support graph (passive check)

First, to know this article, please read and practice active check in here.

Config passive check
Config with nagios core:
vi /usr/local/nagios/etc/nagios.cfg
accept_passive_service_checks option is set to 1 as well.


Manual passive check

Create a plugin like active check article but in define service add two lines:
active_checks_enabled 0
passive_checks_enabled 1


Restart nagios:
sudo -s
service nagios restart
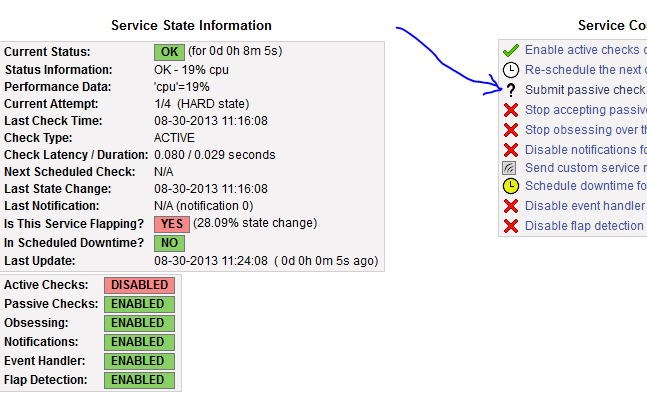
This is the result:

 Click Submit passive check and fill it like this image:

 refresh nagios webpage and wait few seconds and view Status information:

Other way:
Structure:
[<timestamp>] PROCESS_SERVICE_CHECK_RESULT;<host_name>;<service_description>;<service_status>;<plugin_output>
Example:
sudo -s
CHECK="[`date +%s`] PROCESS_SERVICE_CHECK_RESULT;localhost2;Check cpu;0;Ok from commandline"
echo $CHECK >>/usr/local/nagios/var/rw/nagios.cmd


Passive check from remote host

Nagios server (ip: 192.168.0.221)
Install
sudo -s
apt-get install nsca
Edit nsca config:
vi /etc/nsca.cfg
Content to change (if different), can change password to anythink you like but must match client and server:
command_file=/usr/local/nagios/var/rw/nagios.cmd
password=aloha
decryption_method=1
nsca_group=nagios
nsca_user=nagios
Restart nsca
service nsca restart

Client (ip: 192.168.0.33)
Install:
sudo -s
apt-get install nsca-client
Config:
 vi /etc/send_nsca.cfg
change password and encryption_method like server

Check

echo -en "localhost2\tcheck cpu\t0\tCheck Ok from nsca\n" | send_nsca -c /etc/send_nsca.cfg -H 192.168.0.221
Result Ok, but nagios don't do any think.
1 data packet(s) sent to host successfully.
Debug: 

 vi /usr/local/nagios/var/nagios.log

[1377855543] EXTERNAL COMMAND: PROCESS_SERVICE_CHECK_RESULT;localhost2;check cpu;0;Check111 Ok from nsca
[1377855543] Warning: Passive check result was received for service 'check cpu' on host 'localhost2', but the service could not be found!
and this is the reason:
 echo -en "localhost2\tCheck cpu\t0\tCheck Ok from nsca\n" | send_nsca -c /etc/send_nsca.cfg -H 192.168.0.221
Wait for few seconds and data will be update in nagios.
You can see in active check article to see how to create graph.

Tuesday, 27 August 2013

Create a simple Nagios plugin support graph (active check)

In this article, I will post an example of a Nagios plugin support graph.
First, you must install Nagios core and pnp4nagios (I suggest you install like these article because other ways can make some differences).

This code is written by Python, will make random number and return result. You can do with any language can return the same result.


Create plugin

Code

#!/usr/bin/python
import os, sys, random

random = random.randrange(0, 120)

if random < 50:
        print "OK - %s%% cpu|'cpu'=%s%%" % (random, random)
        sys.exit(0)
elif random < 90 and random >= 50:
        print "WARNING - %s%% cpu|'cpu'=%s%%" % (random, random)
        sys.exit(1)
elif random <= 100 and random >= 90:
        print "CRITICAL - %s%% cpu|'cpu'=%s%%" % (random, random)
        sys.exit(2)
else:
        print "UKNOWN - %s%% cpu|'cpu'=%s%%" % (random, random)
        sys.exit(3)

Example result
OK - 47% cpu|'cpu'=47%


Create file

cd /home/
vi plugin.py  (  paste code in vi editor)

chmod 777 plugin.py

Check result
./plugin.py -> UKNOWN - 111% cpu|'cpu'=111%


Config in Nagios (local)
Create a host with service use our plugin
cd /usr/local/nagios/etc
vi test.cfg
paste this content

define host{
        use                     linux-server,host-pnp         ; Name of host template to use
                                                        ; This host definition will inherit all variables that are defined
                                                        ; in (or inherited by) the linux-server host template definition.
        host_name               localhost2
        alias                   localhost2
        address                 127.0.0.1
        }

define service{
        use                             local-service,service-pnp          ; Name of service template to use
        host_name                       localhost2
        service_description             Check cpu
        check_command                   check_cpu
        }

define command{
        command_name    check_cpu
        command_line    /home/plugin.py
        }

vi /usr/local/nagios/etc/nagios.cfg
and this line
cfg_file=/usr/local/nagios/etc/test.cfg


Check config error and restart
/usr/local/nagios/bin/nagios -v /usr/local/nagios/etc/nagios.cfg

service nagios restart


Result
And this is the result:


Click to check cpu:

You can see Status information and Performance Data , this is the result of above red plugin result


Graph will be created from Performance Data with this struct: 'label'=value[UOM];[warn];[crit];[min];[max]

See more here: http://nagiosplug.sourceforge.net/developer-guidelines.html

Wait about half of hour or more, and this is my plugin graph :


Config from remote host, via nrpe:
Install in client (ip: 192.168.0.33)
apt-get install -y python nagios-nrpe-server

Disable nagios3 service
Because I use nagios from source (not nagios3 - dependences of nagios-nrpe-server), so, to disable (to get server lighter), we need:
update-rc.d nagios3 disable (for disable service startup with server)
service nagios3 stop (to stop running service)
update-rc.d nagios3 enable (for enable service startup)

Install and check
client:
create plugin.py at /home/plugin.py like above at client

Config
vi /etc/nagios/nrpe.cfg

add any monitor service or host can get infor at allowed_hosts:
allowed_hosts=127.0.0.1,192.168.0.222
add this plugin command:
command[check_cpu]=/home/plugin.py
Save config file and restart
service nagios-nrpe-server restart 


Install in server (ip: 192.168.0.222)
sudo apt-get install nagios-nrpe-plugin

Check nrpe
/usr/lib/nagios/plugins/check_nrpe -H 192.168.0.33 -c check_cpu
And this is the result:
WARNING - 69% cpu|'cpu'=69%

With this command, you can change command in above local config to check remote host.
In fact, we usually use command like:
/usr/lib/nagios/plugins/check_nrpe -H $HOSTADDRESS$ -c $ARG1$
and check_command like:
check_cpu!check_cpu
 with ip will be replaced in $HOSTADDRESS$ and check_cpu after ! will be replaced in $ARG1$.
Go to document of nagios to view more.

Tuesday, 20 August 2013

Check_MK, one of the best plugin for Nagios

Check_MK is a collection of extensions for the IT-Monitoring-Kernel of Nagios and together with this, and ideally also with PNP4Nagios and NagVis constitutes a complete IT-Monitoring-System. Check_MK is 100% Open-Source and is available under the terms of the GNU GPL.

View homepage to get full information:
http://mathias-kettner.com


First must install nagios: view here

After download and extract from :
http://mathias-kettner.com/check_mk_download.html


Install
Must install libapache2-mod-python first.

Go to extracted folder in terminal.
sudo -s
./setup.sh

Next next next and next.
setup progress will auto detect elements.


setup check_mk

Type y, Enter

Restart nagios and apache2 services
service nagios restart
service apache2 restart


This is the result (image from wiki):


Error when run

When I restart linux, having an error
"Livestatus problem: Cannot connect to  'unix:/usr/local/nagios/var/rw/live': [Errno 111] Connection refused"
This is because pemission, use commands:

chown nagios.nagcmd /usr/local/nagios/var/rw
chmod g+rwx /usr/local/nagios/var/rw
chmod g+s /usr/local/nagios/var/rw

Install graph plugin for Nagios (pnp4nagios)

This article will install pnp4nagios plugin for nagios install from source: see here

Go to web, download and extract source code:
http://sourceforge.net/projects/pnp4nagios/


SETUP

Go to superuser mode
sudo -s

install rrdtool and RRDs Perl Modules (dependences for pnp4nagios)
apt-get install libcgi-pm-perl librrds-perl libgd-gd2-perl libnagios-object-perl rrdtool

Download and extract (in present this is the lastest version)
cd ~/downloads (if not exists: mkdir downloads)
wget http://sourceforge.net/projects/pnp4nagios/files/PNP-0.6/pnp4nagios-0.6.21.tar.gz
tar -xzvf pnp4nagios-0.6.21.tar.gz

Compile and Install
cd pnp4nagios-0.6.21/
./configure
make all
make fullinstall

Restart nagios and apache2 services
service nagios restart
service apache2 restart


FIX ERRORS
go to 127.0.0.1/pnp4nagios
and see like this image:

pnp4nagios apache mod rewrite tientuts blog


Fix:
a2enmod rewrite
 /etc/init.d/apache2 restart (like service apache2 restart)
and do like info in below webpage:
Your environment passed all requirements. Remove or rename the /usr/local/pnp4nagios/share/install.php file now.
go to terminal: sudo nautilus -> go to this page and rename file


Config
Still go to terminal: sudo nautilus.

Go to /usr/local/nagios/etc/nagios.cfg,
Change default fields to this content:

process_performance_data=1
host_perfdata_file=/usr/local/pnp4nagios/var/host-perfdata
service_perfdata_file=/usr/local/pnp4nagios/var/service-perfdata
host_perfdata_file_template=DATATYPE::HOSTPERFDATA\tTIMET::$TIMET$\tHOSTNAME::$HOSTNAME$\tHOSTPERFDATA::$HOSTPERFDATA$\tHOSTCHECKCOMMAND::$HOSTCHECKCOMMAND$\tHOSTSTATE::$HOSTSTATE$\tHOSTSTATETYPE::$HOSTSTATETYPE$\tHOSTOUTPUT::$HOSTOUTPUT$
service_perfdata_file_template=DATATYPE::SERVICEPERFDATA\tTIMET::$TIMET$\tHOSTNAME::$HOSTNAME$\tSERVICEDESC::$SERVICEDESC$\tSERVICEPERFDATA::$SERVICEPERFDATA$\tSERVICECHECKCOMMAND::$SERVICECHECKCOMMAND$\tHOSTSTATE::$HOSTSTATE$\tHOSTSTATETYPE::$HOSTSTATETYPE$\tSERVICESTATE::$SERVICESTATE$\tSERVICESTATETYPE::$SERVICESTATETYPE$\tSERVICEOUTPUT::$SERVICEOUTPUT$
host_perfdata_file_mode=a
service_perfdata_file_mode=a
host_perfdata_file_processing_interval=15
service_perfdata_file_processing_interval=15
host_perfdata_file_processing_command=process-host-perfdata-file
service_perfdata_file_processing_command=process-service-perfdata-file

Go to /usr/local/nagios/etc/objects/commands.cfg, append the command definitions:
define command {
command_name    process-service-perfdata-file
command_line    /usr/local/pnp4nagios/libexec/process_perfdata.pl --bulk=/usr/local/pnp4nagios/var/service-perfdata
}

define command {
command_name    process-host-perfdata-file
command_line    /usr/local/pnp4nagios/libexec/process_perfdata.pl --bulk=/usr/local/pnp4nagios/var/host-perfdata
}
go to /usr/local/pnp4nagios/etc/ , rename rra.cfg-sample files to rra.cfg.


Append two entries to /usr/local/nagios/etc/objects/templates.cfg:

define host {
name            host-pnp
action_url      /pnp4nagios/index.php/graph?host=$HOSTNAME$&srv=_HOST_
register        0
}

define service {
name            service-pnp
action_url      /pnp4nagios/index.php/graph?host=$HOSTNAME$&srv=$SERVICEDESC$
register        0
}
Add above templates to any host or service you want like I change /usr/local/nagios/etc/objects/localhost.cfg
.......
define host{
        use                     linux-server,host-pnp         ; Name of host template to use
                            ; This host definition will inherit all variables that are defined
                            ; in (or inherited by) the linux-server host template definition.
        host_name               localhost
        alias                   localhost
        address                 127.0.0.1
        }

......
define service{
        use                             local-service,service-pnp          ; Name of service template to use
        host_name                       localhost
        service_description             PING
    check_command            check_ping!100.0,20%!500.0,60%
        }
........

Restart nagios and apache2 services like aboves and we will see graph icon in hosts and services was added template.
This is the result:

pnp4nagios graph icon tientuts blog


Friday, 16 August 2013

Tip to improve autocomplete unknow variables in python with pydev

See this article first.

Python use dynamic type, so IDE can unknow variable in some cases like if you want autocomplete string type:
a.
Ctrl+space and pydev don't show any thing.

I know some ways to solve:

Using assert and isinstance

import string

def fun1(a):
    a = string(a)
    a.

fun1("hello")

Cast the object/variable back to its type


import string

def fun1(a):
    a = string(a)
    a.

fun1("hello")


New on PyDev 2.8.0
http://pydev.org/manual_adv_type_hints.html

Example:
import string

def fun1(a):
    '@type a: string'
    a.

fun1("hello")


or you can autocomple If write two charactor, this will autocomplete in all classes

Thursday, 15 August 2013

Validate string with a regular expression

Regular expression is really an amazing function in string processing. In this article, I will introduce a popular case using regular expression to solve validate string with muli-conditions: validate password strength.

Requirements
  • program language must support regular expression with look lookahead assertion.

These are the rules
  • The password length must be greater than or equal to 7 characters
  • The password must contain one or more uppercase characters
  • The password must contain one or more lowercase characters
  • The password must contain at least one numeric character.

And this is the answer
(?=^.{7,}$)(?=.*\d)(?![.\n])(?=.*[A-Z])(?=.*[a-z]).*$
You can see colors and very easy to know. The end to finish a regex (all of first statement is only condition, must have main body and check that end with end of line (with multiline mode) or end of string (with singleline mode).

Test online with